使用 Microsoft Agent Framework 与 Azure AI Foundry 为多智能体系统构建可观测性
智能体(Agentic)应用正在重塑企业自动化,但它们动态的工具链和“隐式推理”也让线上运行与排障变得格外棘手。本文整理并改写自 Microsoft Foundry Blog 的一篇文章,内容聚焦于:如何为基于 Microsoft Agent Framework 的服务接入 OpenTelemetry,将 trace 投递到 Azure AI Foundry 的可观测能力中,并建立一套实用工作流,用于在生产环境中调试、评估并持续改进多智能体行为。
文中还会展示如何围绕“推理步骤”和“工具调用”(OpenAPI / MCP)打点 span,让你对 agentic 工作流获得足够深入、可追踪的可见性。
适合哪些读者?
- 开发者:使用 Microsoft Agent Framework(MAF)在 .NET 或 Python 中构建智能体
- 架构师 / SRE:希望在 Azure AI Foundry 上部署时获得企业级可见性、治理与可靠性
为什么智能体系统离不开可观测性
传统日志对智能体系统往往不够用:
- 没有显式的 span / event 时,推理与路由(选哪个工具?用哪份文档?)几乎是黑盒
- 故障经常发生在组件之间(例如:检索不匹配、工具 schema 漂移)
- 如果没有贯穿 agents ⇄ tools ⇄ data stores 的 trace,就很难复现或评估系统行为
Microsoft 提出了一些多智能体可观测性模式与 OpenTelemetry(OTel)惯例,用于把 Agent Framework、Foundry 以及常见技术栈里的 trace 统一起来,从而让每个任务都有一条“可串起来的时间线”。
参考架构
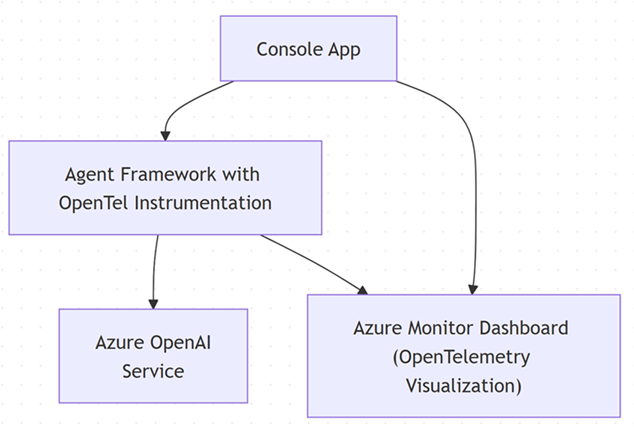
关键能力
- 智能体编排与部署:通过 Microsoft Agent Framework
- 模型访问:使用 Foundry 的 OpenAI 兼容端点
- OpenTelemetry:为 traces/spans + attributes(agent、tool、retrieval、latency、tokens 等)提供统一标准
分步实现
**假设:**示例使用 Azure Monitor(通过 Application Insights)作为 OpenTelemetry exporter;如果你使用其他 exporter,也可以用相同思路进行配置。
前置条件
- .NET 8 SDK 或更高版本
- Azure OpenAI 服务(endpoint、API key、已部署的模型)
- Application Insights 与 Grafana
-
创建一个带 OpenTelemetry 的 Agent(ASP.NET Core 或控制台应用)
安装所需包:
dotnet add package Azure.AI.OpenAI
dotnet add package Azure.Monitor.OpenTelemetry.Exporter
dotnet add package Microsoft.Agents.AI.OpenAI
dotnet add package Microsoft.Extensions.Logging
dotnet add package OpenTelemetry
dotnet add package OpenTelemetry.Trace
dotnet add package OpenTelemetry.Metrics
dotnet add package OpenTelemetry.Extensions.Hosting
dotnet add package OpenTelemetry.Instrumentation.Http
配置环境变量:
AZURE_OPENAI_ENDPOINT: https://<your_service_name>.openai.azure.com/
AZURE_OPENAI_API_KEY: <your_azure_openai_apikey>
APPLICATIONINSIGHTS_CONNECTION_STRING: <your_application_insights_connectionstring_for_azuremonitor_exporter>
在启动时一次性配置 tracing:
var applicationInsightsConnectionString = Environment.GetEnvironmentVariable("APPLICATIONINSIGHTS_CONNECTION_STRING");

// Create a resource describing the service
var resource = ResourceBuilder.CreateDefault()
    .AddService(serviceName: ServiceName)
    .AddAttributes(new Dictionary<string, object>
    {
        ["deployment.environment"] = "development",
        ["service.instance.id"] = Environment.MachineName
    })
    .Build();

// Setup OpenTelemetry TracerProvider
var traceProvider = Sdk.CreateTracerProviderBuilder()
    .SetResourceBuilder(ResourceBuilder.CreateDefault().AddService(ServiceName))
    .AddSource(SourceName)
    .AddSource("Microsoft.Agents.AI")
    .AddHttpClientInstrumentation()
    .AddAzureMonitorTraceExporter(options =>
    {
        options.ConnectionString = applicationInsightsConnectionString;
    })
    .Build();

// Setup OpenTelemetry MeterProvider
var meterProvider = Sdk.CreateMeterProviderBuilder()
    .SetResourceBuilder(ResourceBuilder.CreateDefault().AddService(ServiceName))
    .AddMeter(SourceName)
    .AddAzureMonitorMetricExporter(options =>
    {
        options.ConnectionString = applicationInsightsConnectionString;
    })
    .Build();

// Configure DI and OpenTelemetry
var serviceCollection = new ServiceCollection();

// Setup Logging with OpenTelemetry and Application Insights
serviceCollection.AddLogging(loggingBuilder =>
    {
        loggingBuilder.SetMinimumLevel(LogLevel.Debug);
        loggingBuilder.AddOpenTelemetry(options =>
        {
            options.SetResourceBuilder(ResourceBuilder.CreateDefault().AddService(ServiceName));
            options.IncludeScopes = true;
            options.IncludeFormattedMessage = true;
            options.AddAzureMonitorLogExporter(exporterOptions =>
            {
                exporterOptions.ConnectionString = applicationInsightsConnectionString;
            });
        });
        loggingBuilder.AddApplicationInsights(
            configureTelemetryConfiguration: (config) =>
            {
                config.ConnectionString = Environment.GetEnvironmentVariable("APPLICATIONINSIGHTS_CONNECTION_STRING");
            },
            configureApplicationInsightsLoggerOptions: options =>
            {
                options.TrackExceptionsAsExceptionTelemetry = true;
                options.IncludeScopes = true;
            });
    });
配置自定义指标与 ActivitySource:
using var activitySource = new ActivitySource(SourceName);
using var meter = new Meter(SourceName);

// Create custom metrics
var interactionCounter = meter.CreateCounter<long>("chat_interactions_total", description: "Total number of chat interactions");
var responseTimeHistogram = meter.CreateHistogram<double>("chat_response_time_ms", description: "Chat response time in milliseconds");
2. 接入(Wire-up)AI Agent:
// Create OpenAI client
var endpoint = Environment.GetEnvironmentVariable("AZURE_OPENAI_ENDPOINT");
var apiKey = Environment.GetEnvironmentVariable("AZURE_OPENAI_API_KEY");
var deploymentName = "gpt-4o-mini";

using var client = new AzureOpenAIClient(new Uri(endpoint), new AzureKeyCredential(apiKey))
    .GetChatClient(deploymentName)
    .AsIChatClient()
    .AsBuilder()
    .UseOpenTelemetry(sourceName: SourceName, configure: (cfg) => cfg.EnableSensitiveData = true)
    .Build();

logger.LogInformation("Creating Agent with OpenTelemetry instrumentation");

// Create AI Agent
var agent = new ChatClientAgent(
    client,
    name: "AgentObservabilityDemo",
    instructions: "You are a helpful assistant that provides concise and informative responses.")
    .AsBuilder()
    .UseOpenTelemetry(SourceName, configure: (cfg) => cfg.EnableSensitiveData = true)
    .Build();

var thread = agent.GetNewThread();

logger.LogInformation("Agent created successfully with ID: {AgentId}", agent.Id);
3. 用语义属性打点 Agent 逻辑,并调用 OpenAI 兼容 API:
// Create a parent span for the entire agent session
using var sessionActivity = activitySource.StartActivity("Agent Session");
Console.WriteLine($"Trace ID: {sessionActivity?.TraceId} ");

var sessionId = Guid.NewGuid().ToString("N");
sessionActivity?
    .SetTag("agent.name", "AgentObservabilityDemo")
    .SetTag("session.id", sessionId)
    .SetTag("session.start_time", DateTimeOffset.UtcNow.ToString("O"));

logger.LogInformation("Starting agent session with ID: {SessionId}", sessionId);
using (logger.BeginScope(new Dictionary<string, object> { ["SessionId"] = sessionId, ["AgentName"] = "AgentObservabilityDemo" }))
{
    var interactionCount = 0;
    while (true)
    {
        Console.Write("You (or 'exit' to quit): ");
        var input = Console.ReadLine();

        if (string.IsNullOrWhiteSpace(input) || input.Equals("exit", StringComparison.OrdinalIgnoreCase))
        {
            logger.LogInformation("User requested to exit the session");
            break;
        }

        interactionCount++;
        logger.LogInformation("Processing interaction #{InteractionCount}", interactionCount);

        // Create a child span for each individual interaction
        using var activity = activitySource.StartActivity("Agent Interaction");
        activity?
            .SetTag("user.input", input)
            .SetTag("agent.name", "AgentObservabilityDemo")
            .SetTag("interaction.number", interactionCount);

        var stopwatch = Stopwatch.StartNew();

        try
        {
            logger.LogInformation("Starting agent execution for interaction #{InteractionCount}", interactionCount);

            var response = await agent.RunAsync(input);
            Console.WriteLine($"Agent: {response}");
            Console.WriteLine();

            stopwatch.Stop();
            var responseTimeMs = stopwatch.Elapsed.TotalMilliseconds;

            // Record metrics
            interactionCounter.Add(1, new KeyValuePair<string, object?>("status", "success"));
            responseTimeHistogram.Record(responseTimeMs, new KeyValuePair<string, object?>("status", "success"));

            activity?.SetTag("interaction.status", "success");
            logger.LogInformation("Agent interaction #{InteractionNumber} completed successfully in {ResponseTime:F2} seconds", interactionCount, responseTimeMs);
        }
        catch (Exception ex)
        {
            Console.WriteLine($"Error: {ex.Message}");
            Console.WriteLine();

            stopwatch.Stop();
            var responseTimeMs = stopwatch.Elapsed.TotalSeconds;

            // Record error metrics
            interactionCounter.Add(1, new KeyValuePair<string, object?>("status", "error"));
            responseTimeHistogram.Record(responseTimeMs,
                new KeyValuePair<string, object?>("status", "error"));

            activity?
                .SetTag("response.success", false)
                .SetTag("error.message", ex.Message)
                .SetStatus(ActivityStatusCode.Error, ex.Message);
            logger.LogError(ex, "Agent interaction #{InteractionNumber} failed after {ResponseTime:F2} seconds: {ErrorMessage}",
                interactionCount, responseTimeMs, ex.Message);
        }
    }

    // Add session summary to the parent span
    sessionActivity?
        .SetTag("session.total_interactions", interactionCount)
        .SetTag("session.end_time", DateTimeOffset.UtcNow.ToString("O"));

    logger.LogInformation("Agent session completed. Total interactions: {TotalInteractions}", interactionCount);
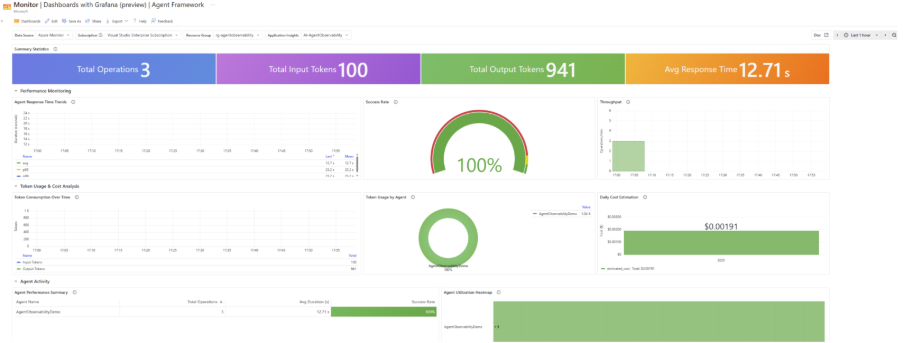
Azure Monitor 仪表板
当运行该 agent 并产生一些流量后,Azure Monitor 中的仪表板会出现类似下图的内容:
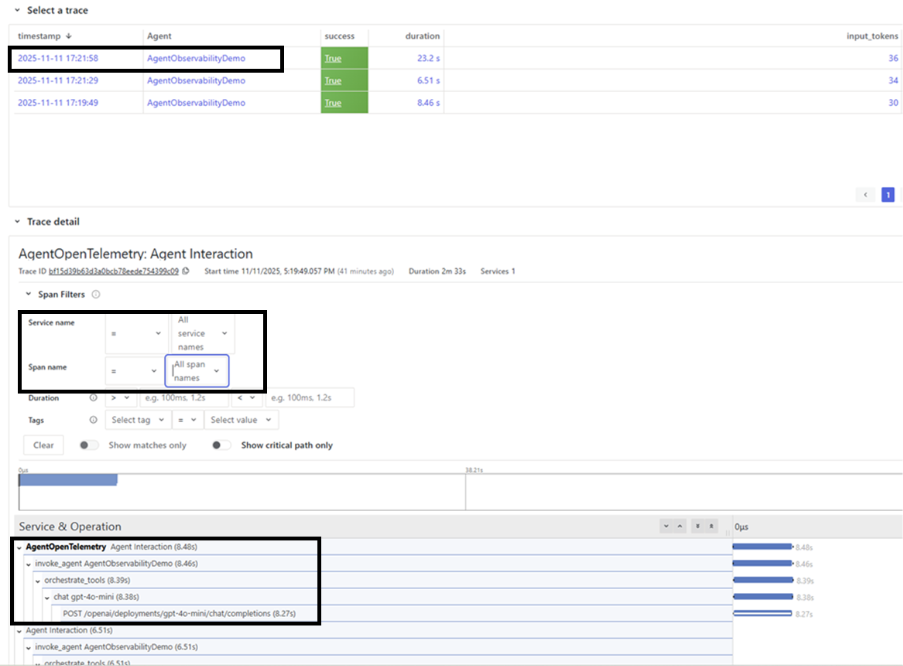
可以通过相关 filter 下钻到具体的 service / activity source / spans:
示例中展示的关键特性
- 结合 Microsoft Agent Framework 的 OpenTelemetry instrumentation
- 面向用户交互的自定义 metrics
- 端到端的遥测关联(Telemetry correlation)
- 指标与日志交互结合的实时可视化
延伸阅读
- 本文作者:BeanHsiang
- 本文链接:https://beanhsiang.github.io/post/2025-12-12-observability-for-multi-agent-systems-with-microsoft-agent-framework-and-azure-ai-foundry/
- 版权声明:本作品采用知识共享署名-非商业性使用-禁止演绎 4.0 国际许可协议. 进行许可,非商业转载请注明出处(作者,原文链接),商业转载请联系作者获得授权。